Data from Interviews
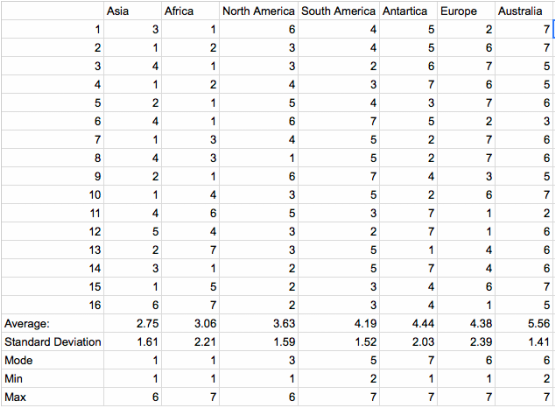
The data table above shows the results from the interviews conducted. Column 1 represents the interviewees labeled 1-16. As you read left to right, the numbers represent the order in which that continent was put from biggest to smallest. For example, person 1 placed as Asia as number 3, Africa as number 1, North America as number 6, etc. From the data, we have concluded that Antarctica and Europe were the most out of order. We can see this by looking at the average of each continent. The lowest score for the average represents the continent most picked as the biggest, and the highest score represents the continent most picked as the smallest.
